# Service Graph
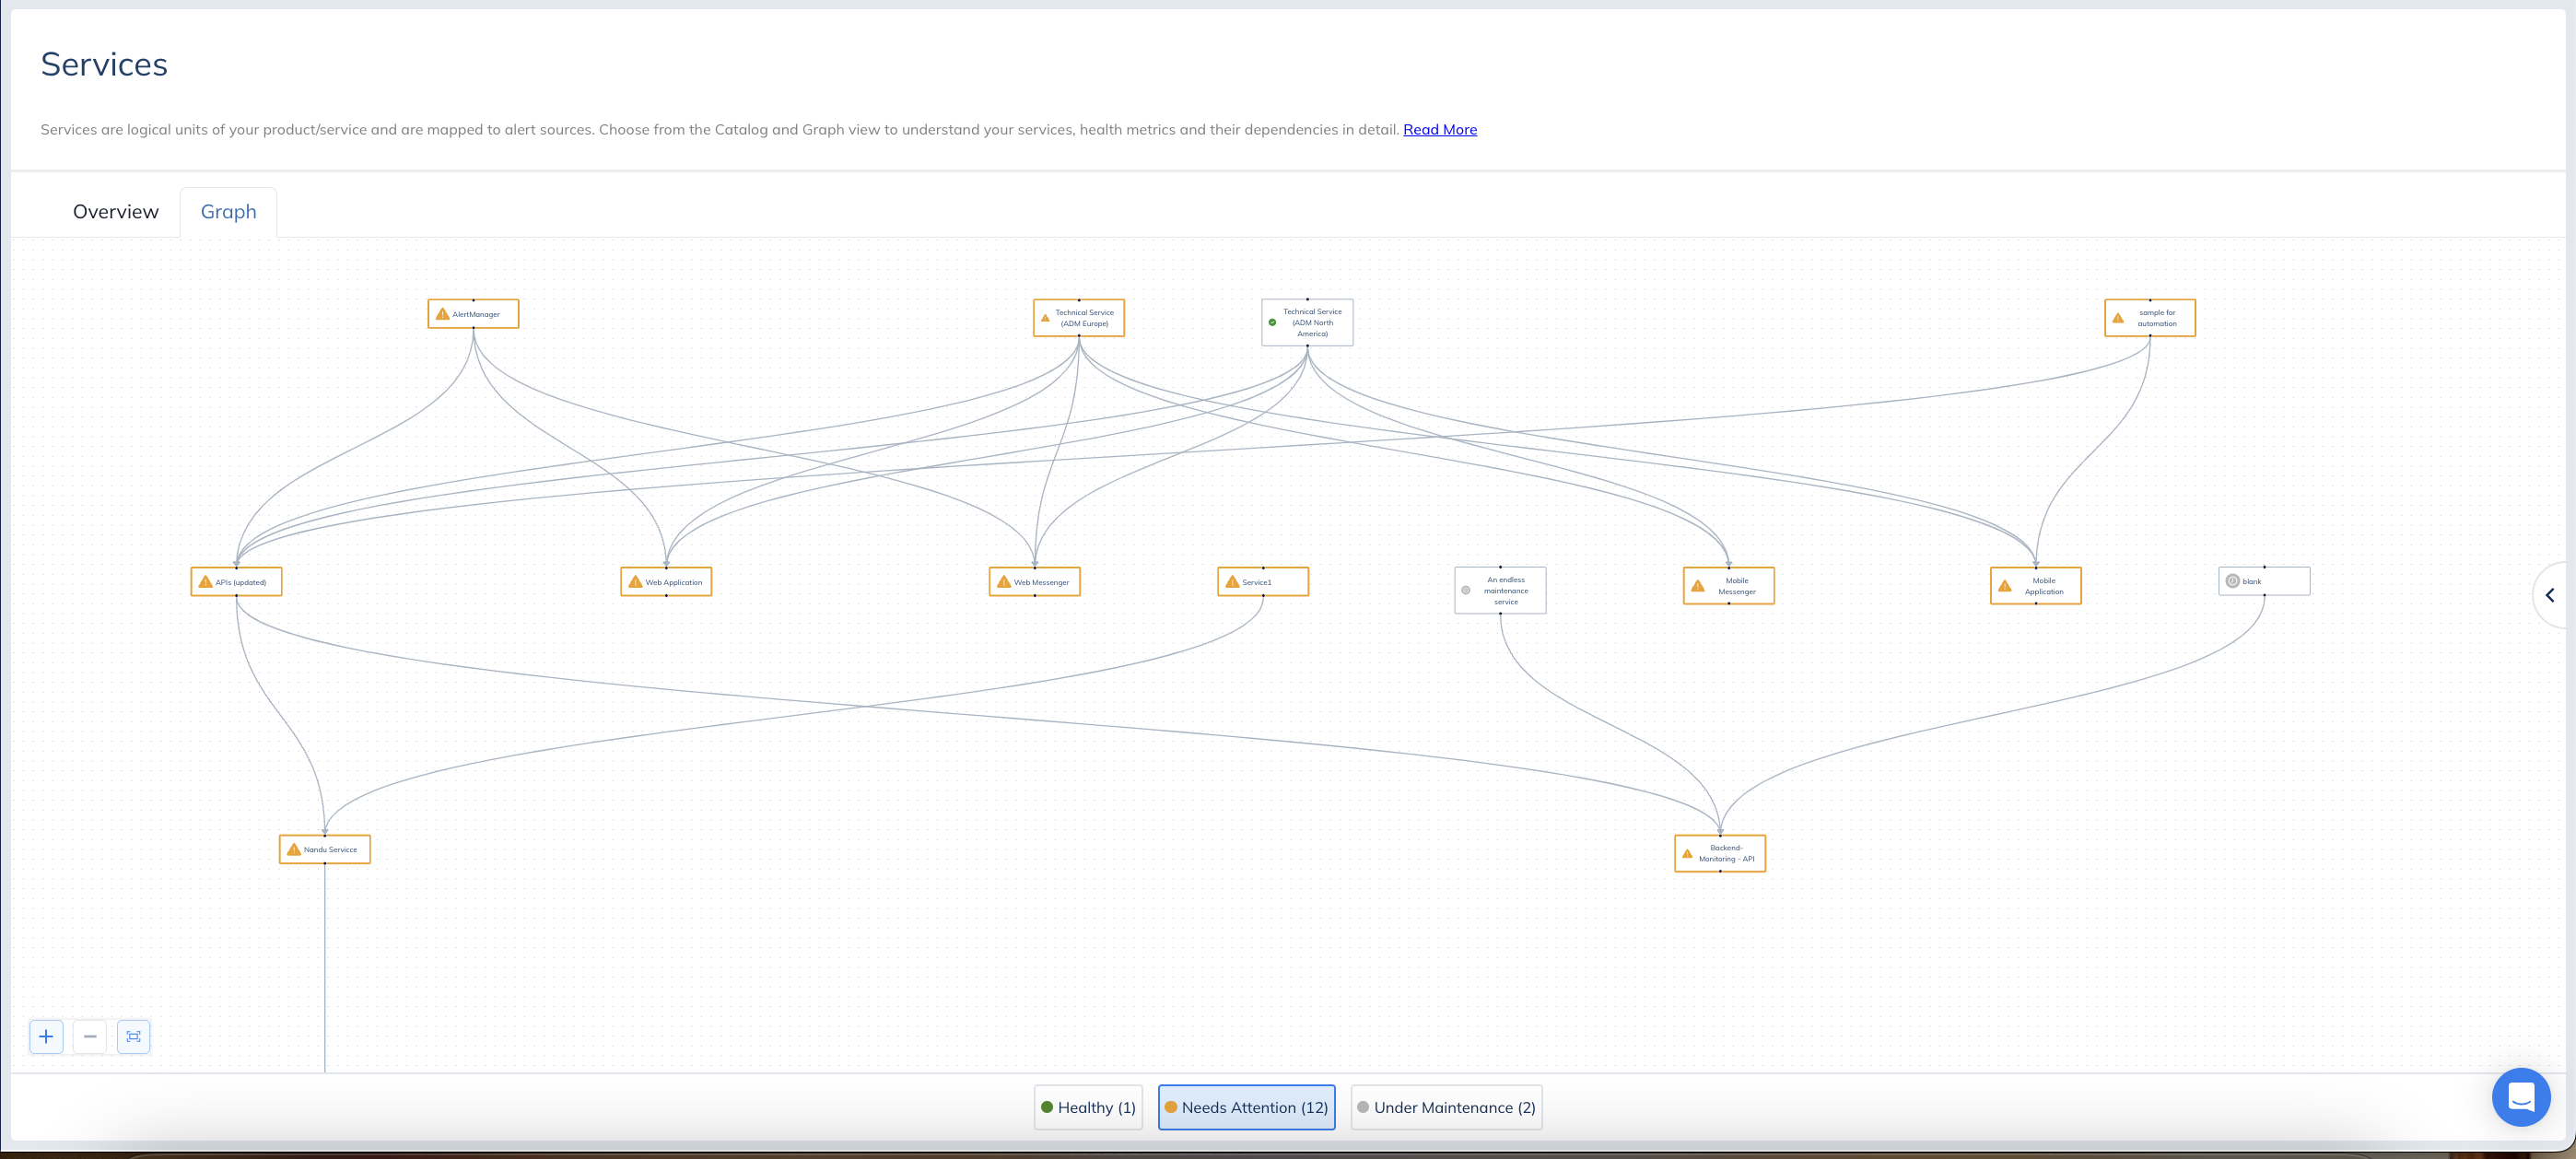
The Service Graph in Squadcast is an interactive map showcasing the dependencies among your services. This visual representation provides a quick overview of service health and interconnections.
During incident response, leverage the Service Graph to understand the full impact of an issue, identify the probable cause, and enhance cross-team collaboration.
Image. Service Graph
{% hint style="info" %} **Note:** This feature will be available in the [Premium and Enterprise plans only](https://www.squadcast.com/pricing).
{% endhint %}
## View Service Graph
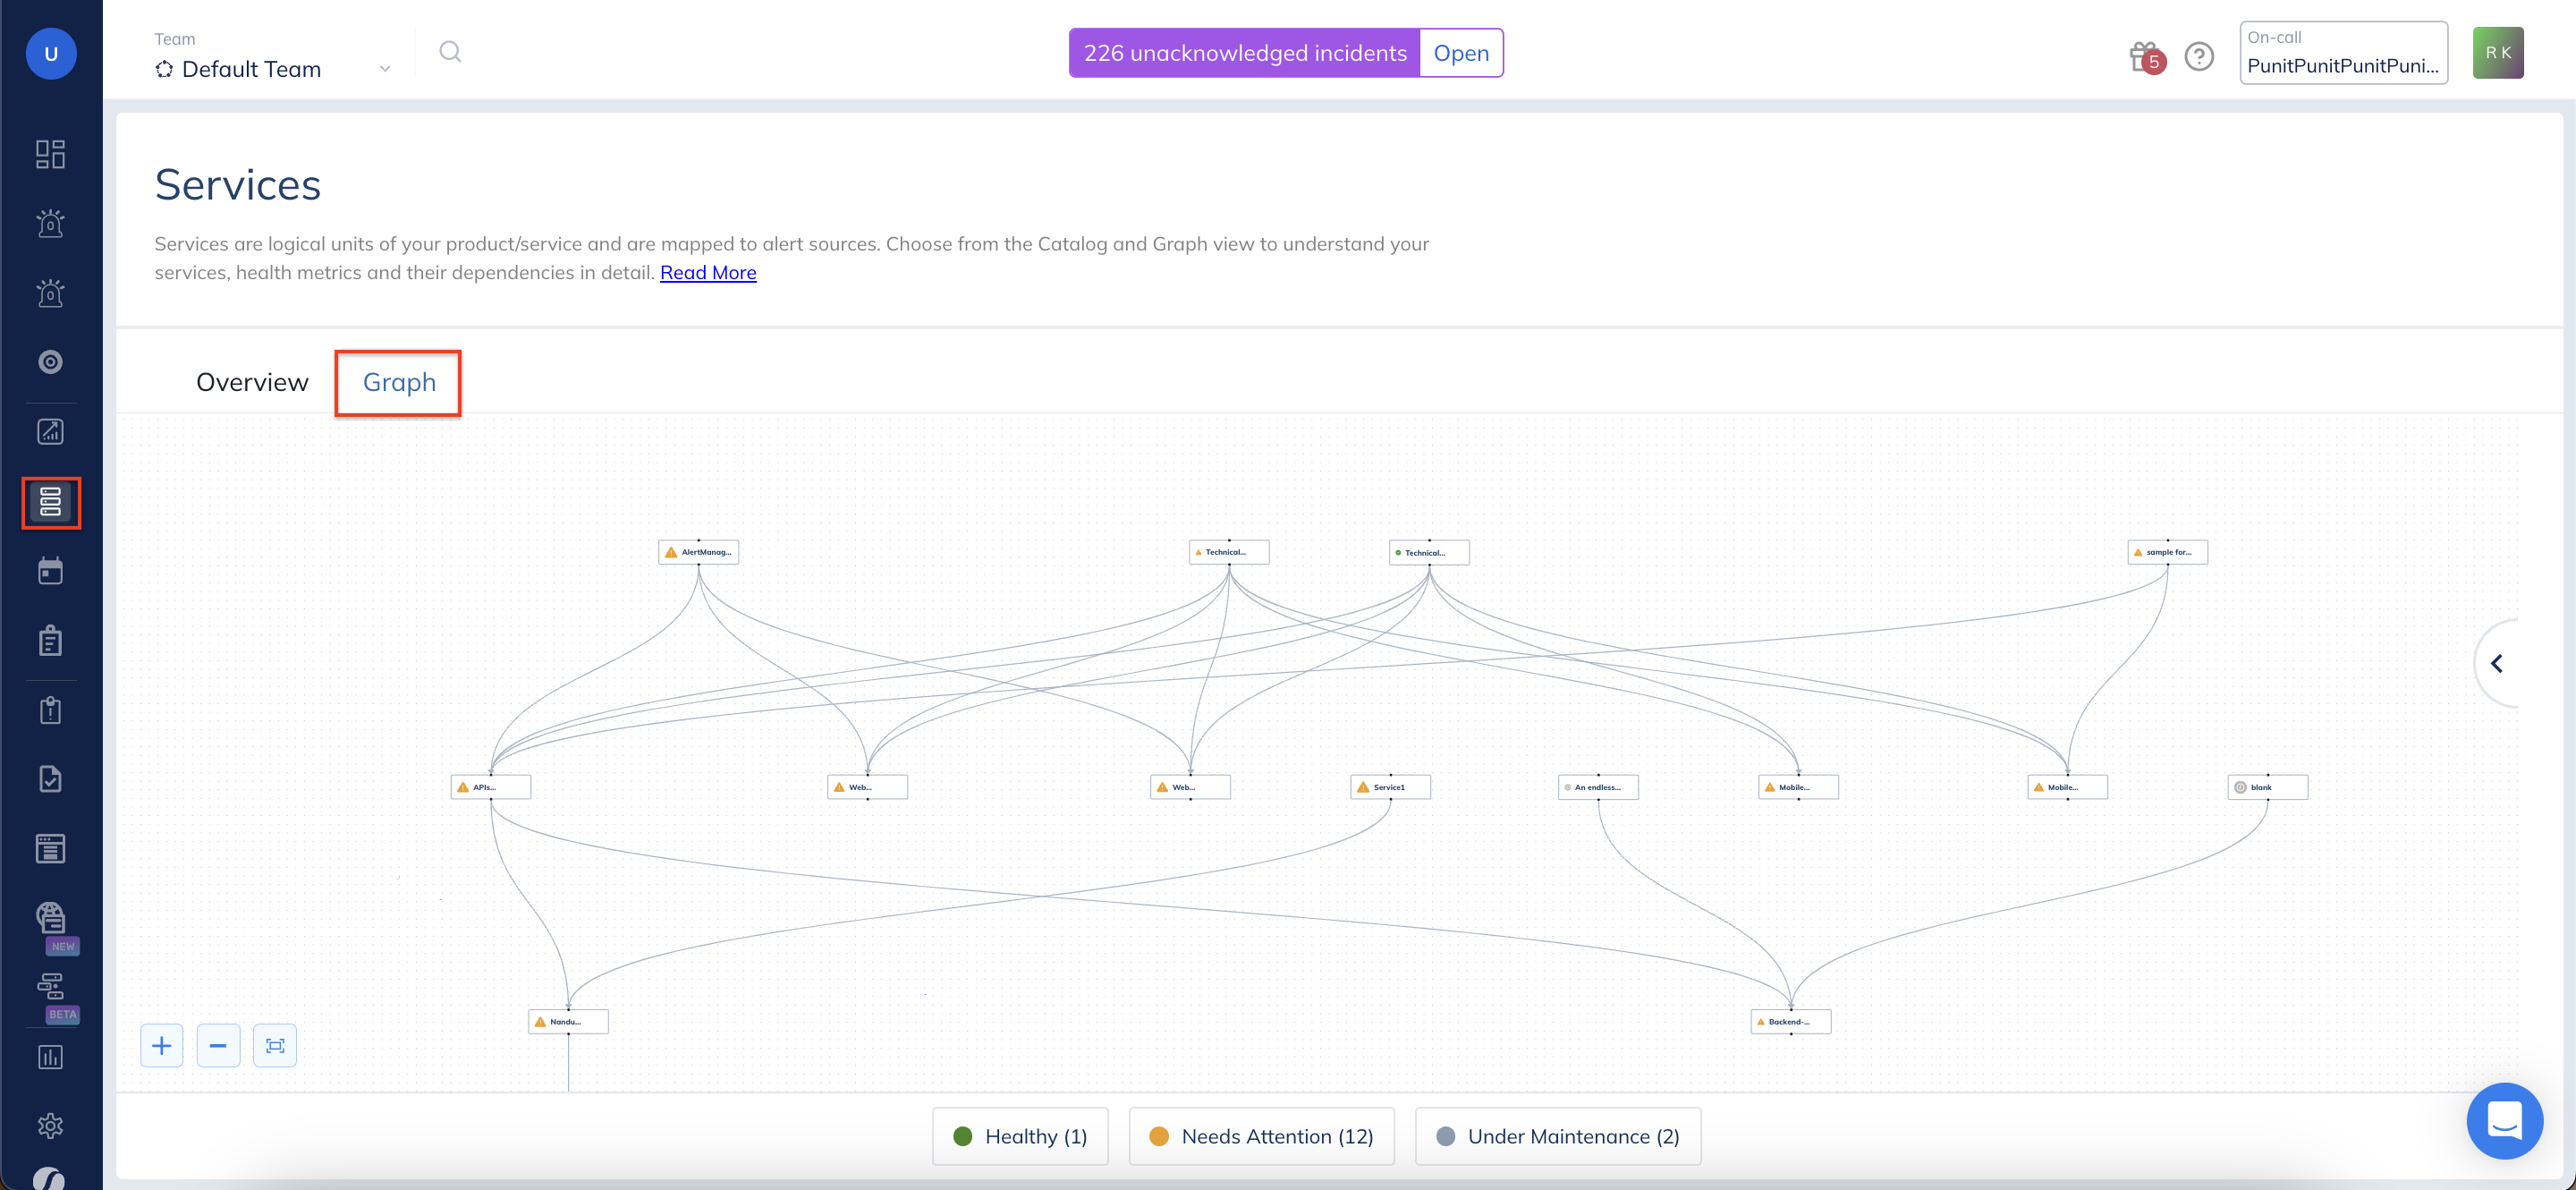
To view the service graph, Navigate to **Services** -> **Graph**.
The graph only displays services that have one or more [dependency relationships](https://support.squadcast.com/service-overview#service-dependency). Any services that do not yet have dependency relationships will be listed in the right panel under Independent Services. You can click on the services to view more details about them.
Image. Access Service Graph
Image. Access details of the selected Service.
## Service Graph Actions
This graph is auto-generated by Squadcast based on the service dependencies you create.
* Users can zoom in and out, fit to the screen to view the graph.
* User can interact with the elements of the graph by dragging the components to better visualize it as per their needs and they can further lock this created view.
* Users can select to view the right panel for the displayed services.
{% hint style="info" %} **Note:** Any interaction done on this graph is retained for the current session only. If you navigate to a different page or close the application, the service nodes move to the default graph position.
{% endhint %}
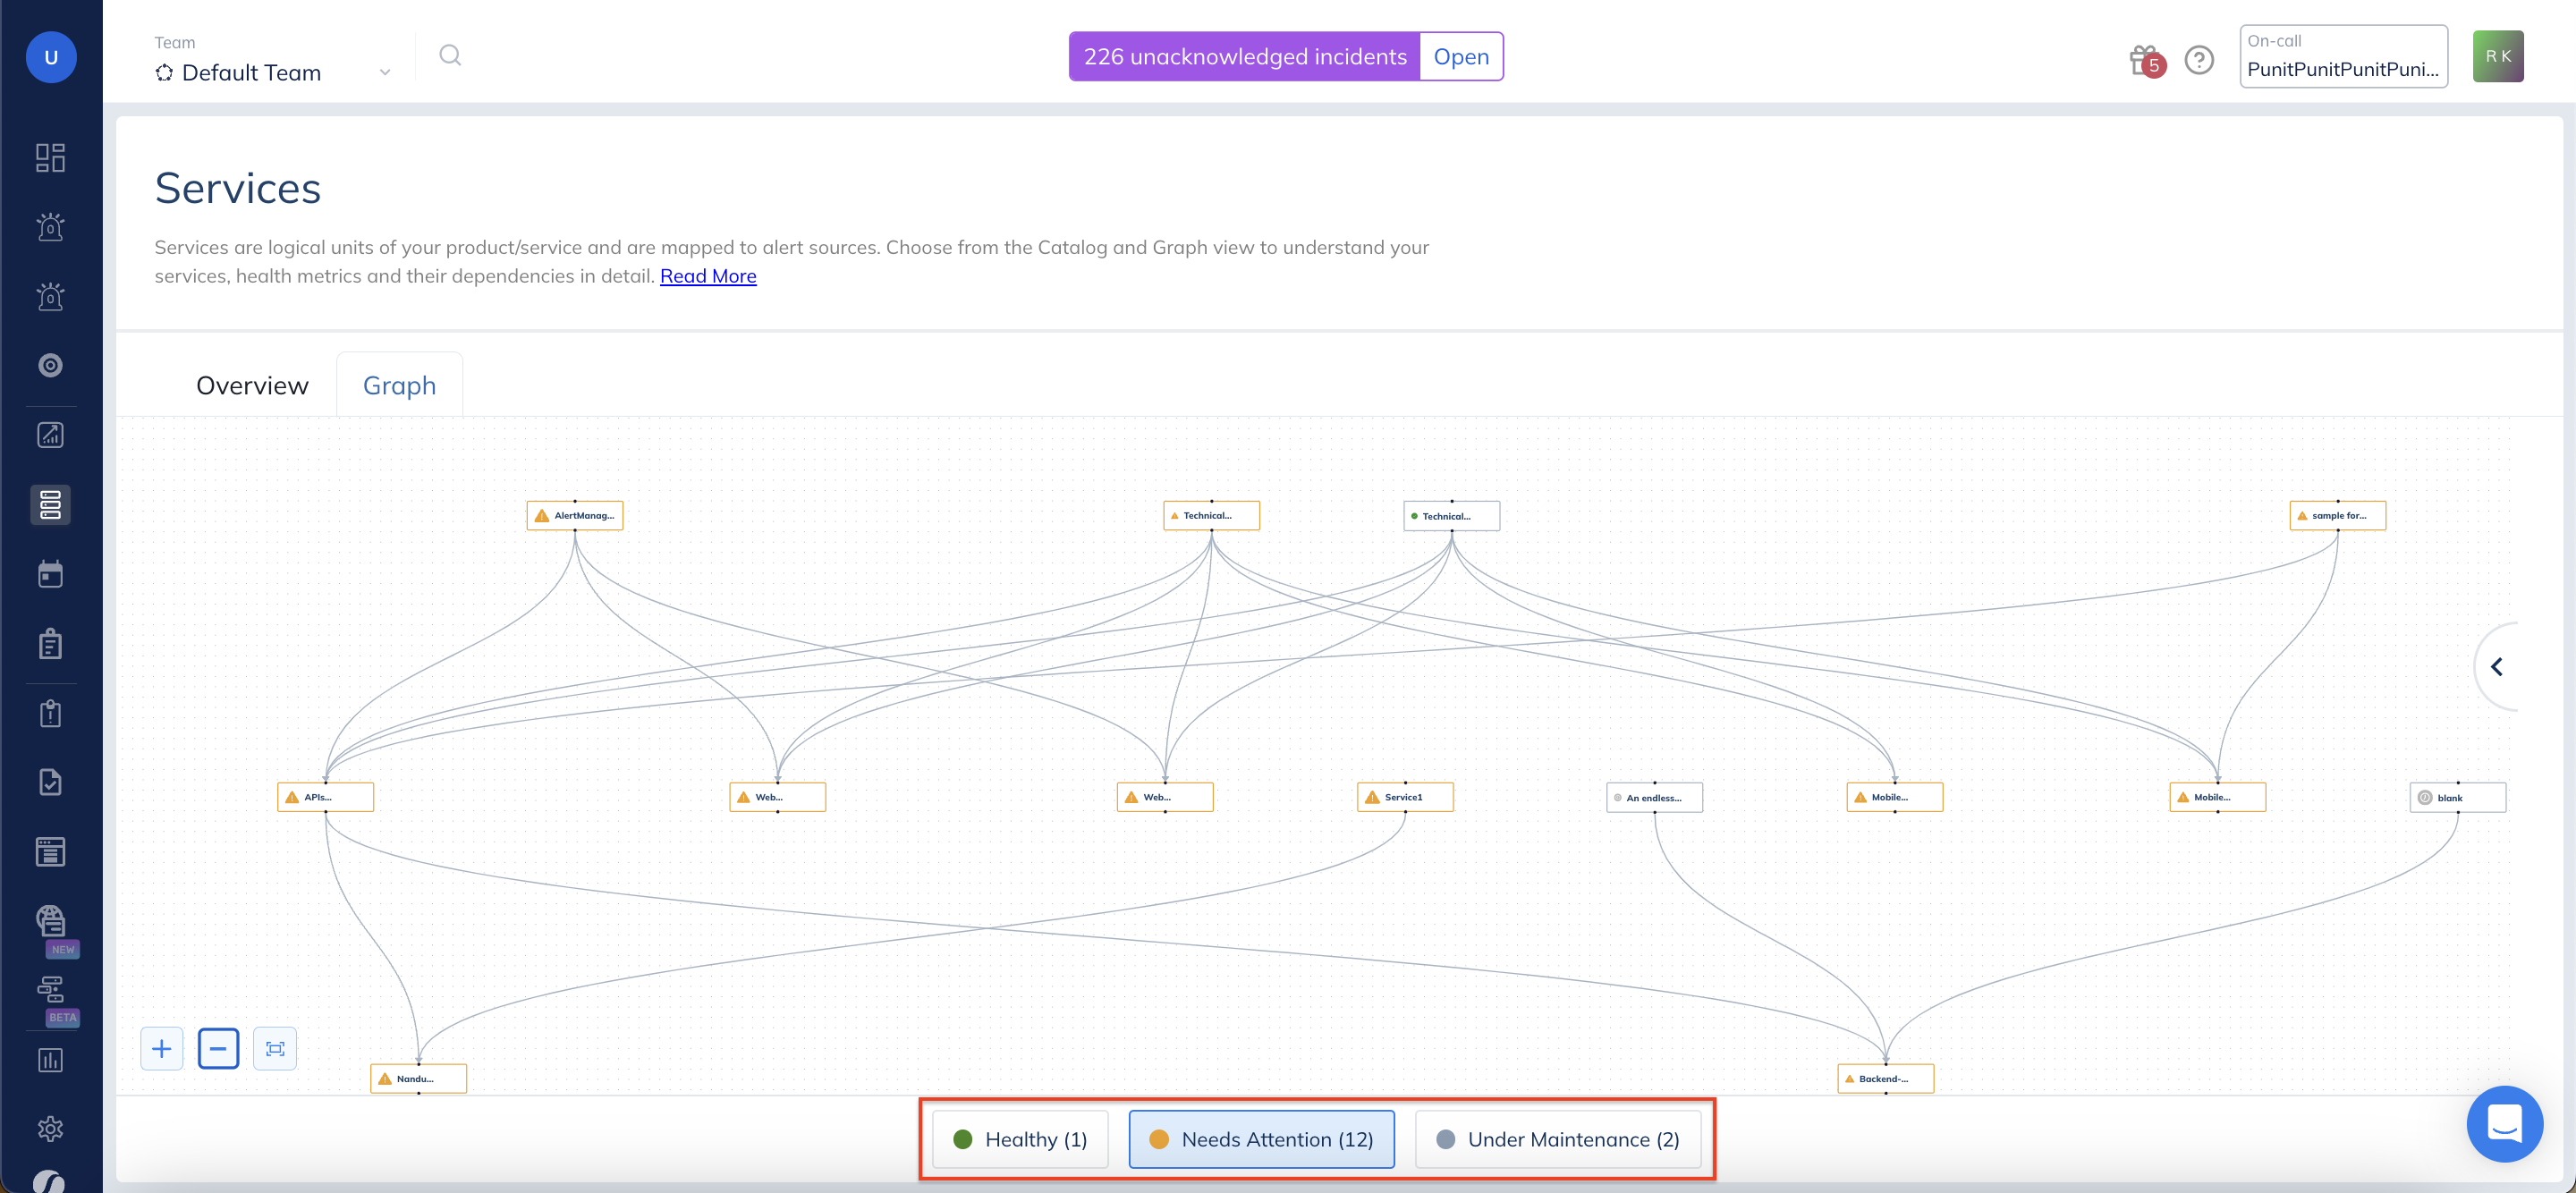
### Filters
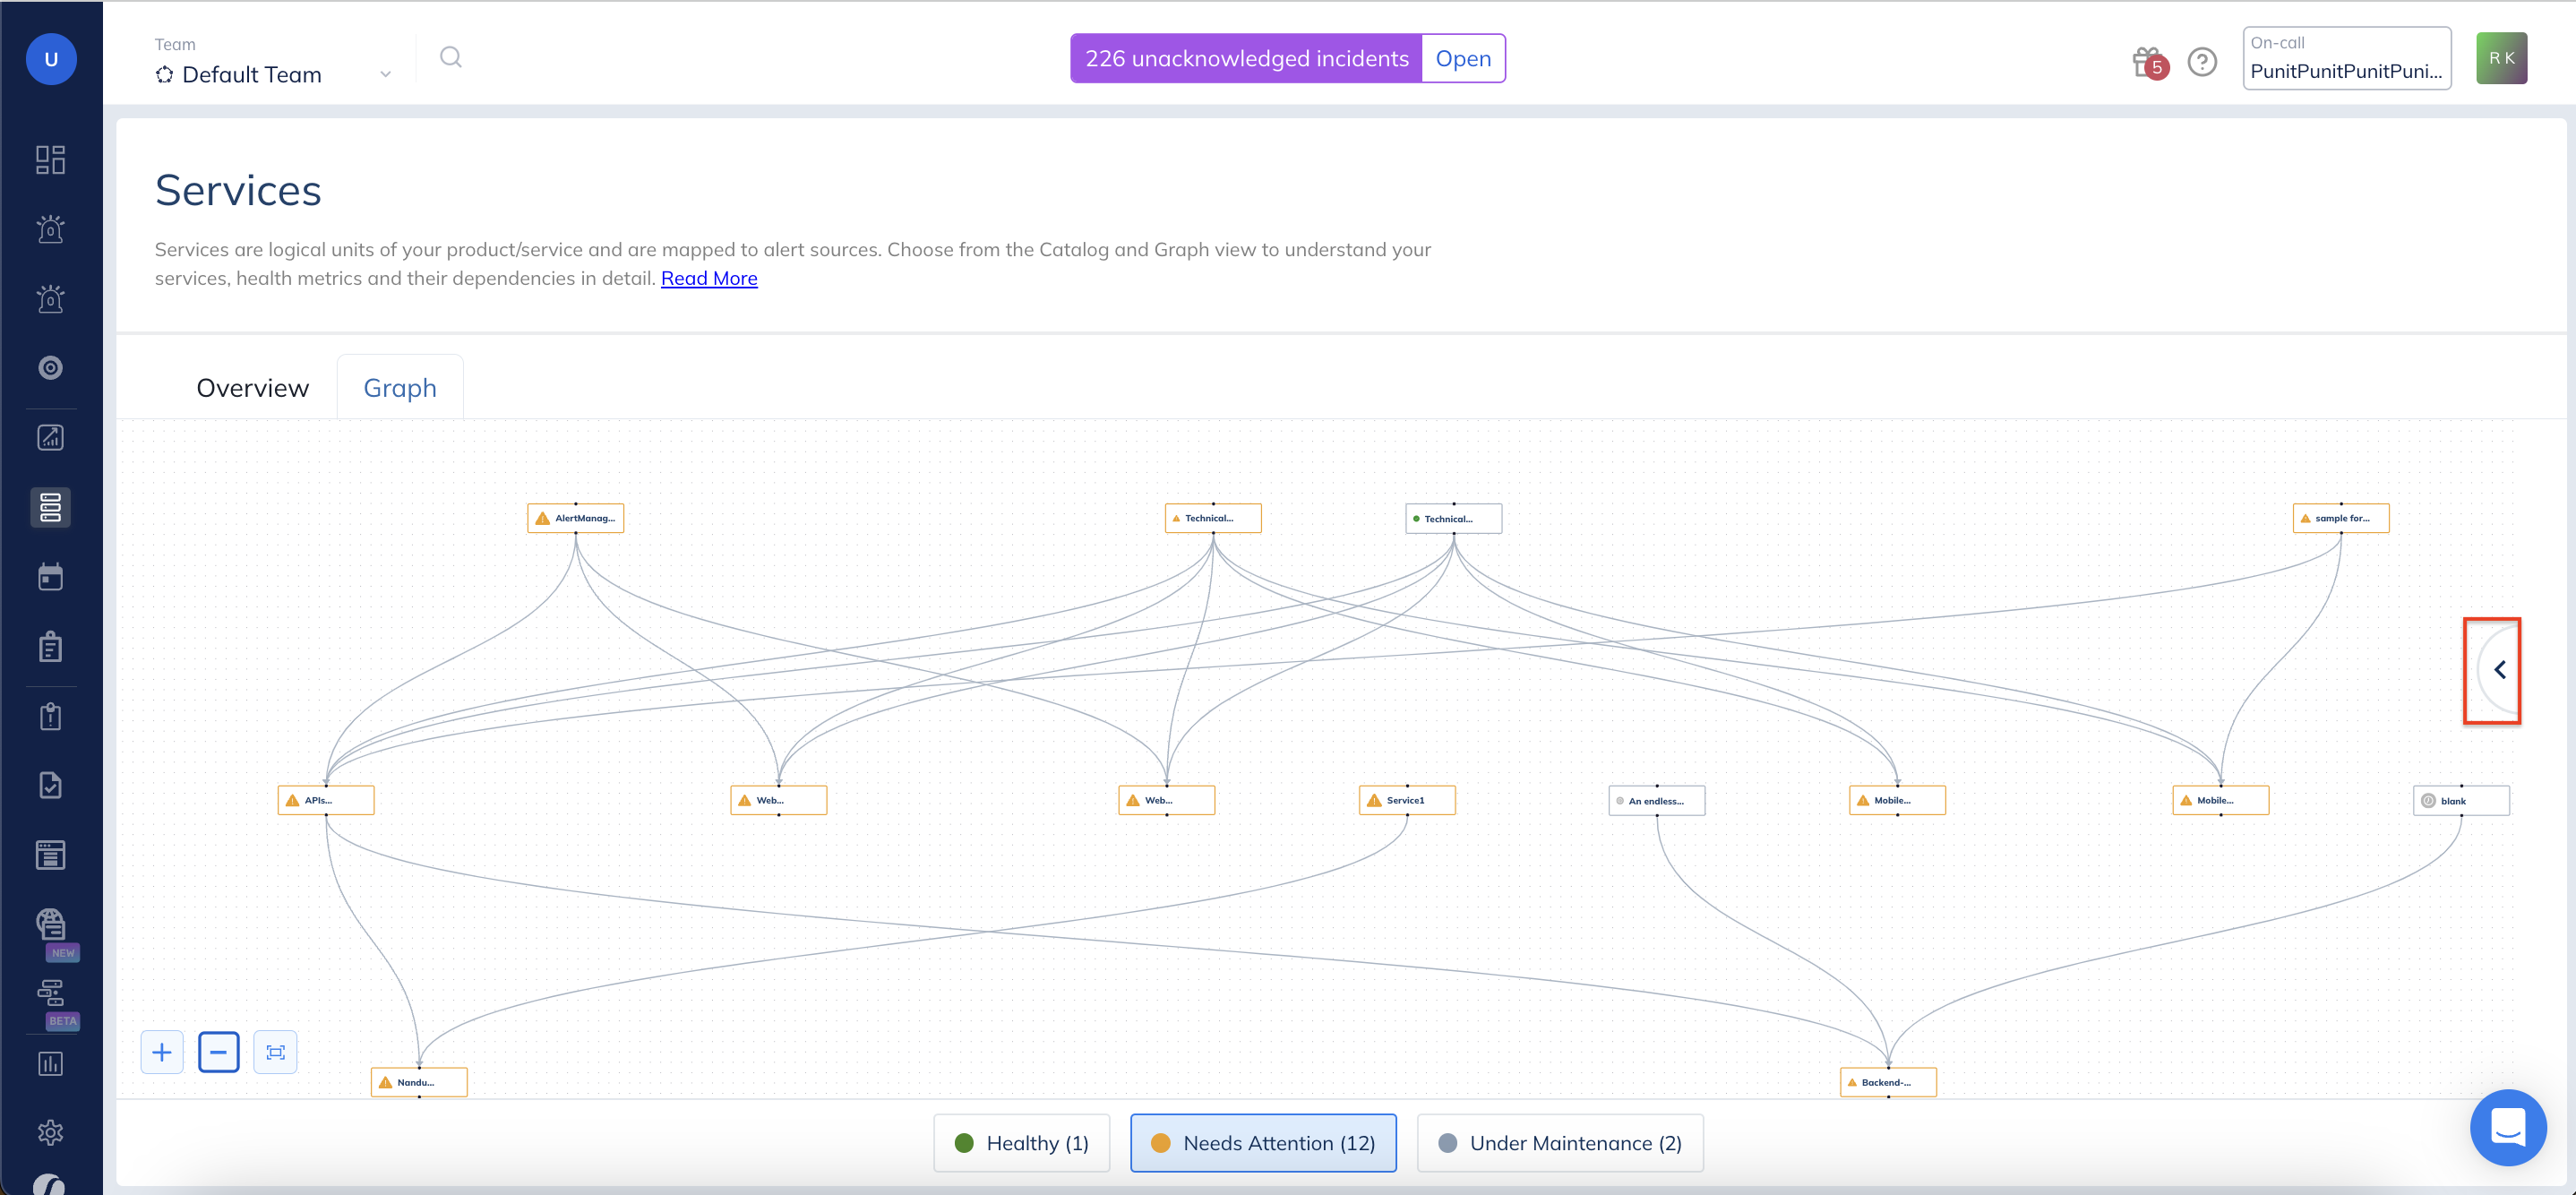
To focus on services with a specific status, users can leverage the filters on the bottom menu. Clicking on a status will highlight all the services in that state.
Image. Status Filters for the Service Graph
## **Right Panel**
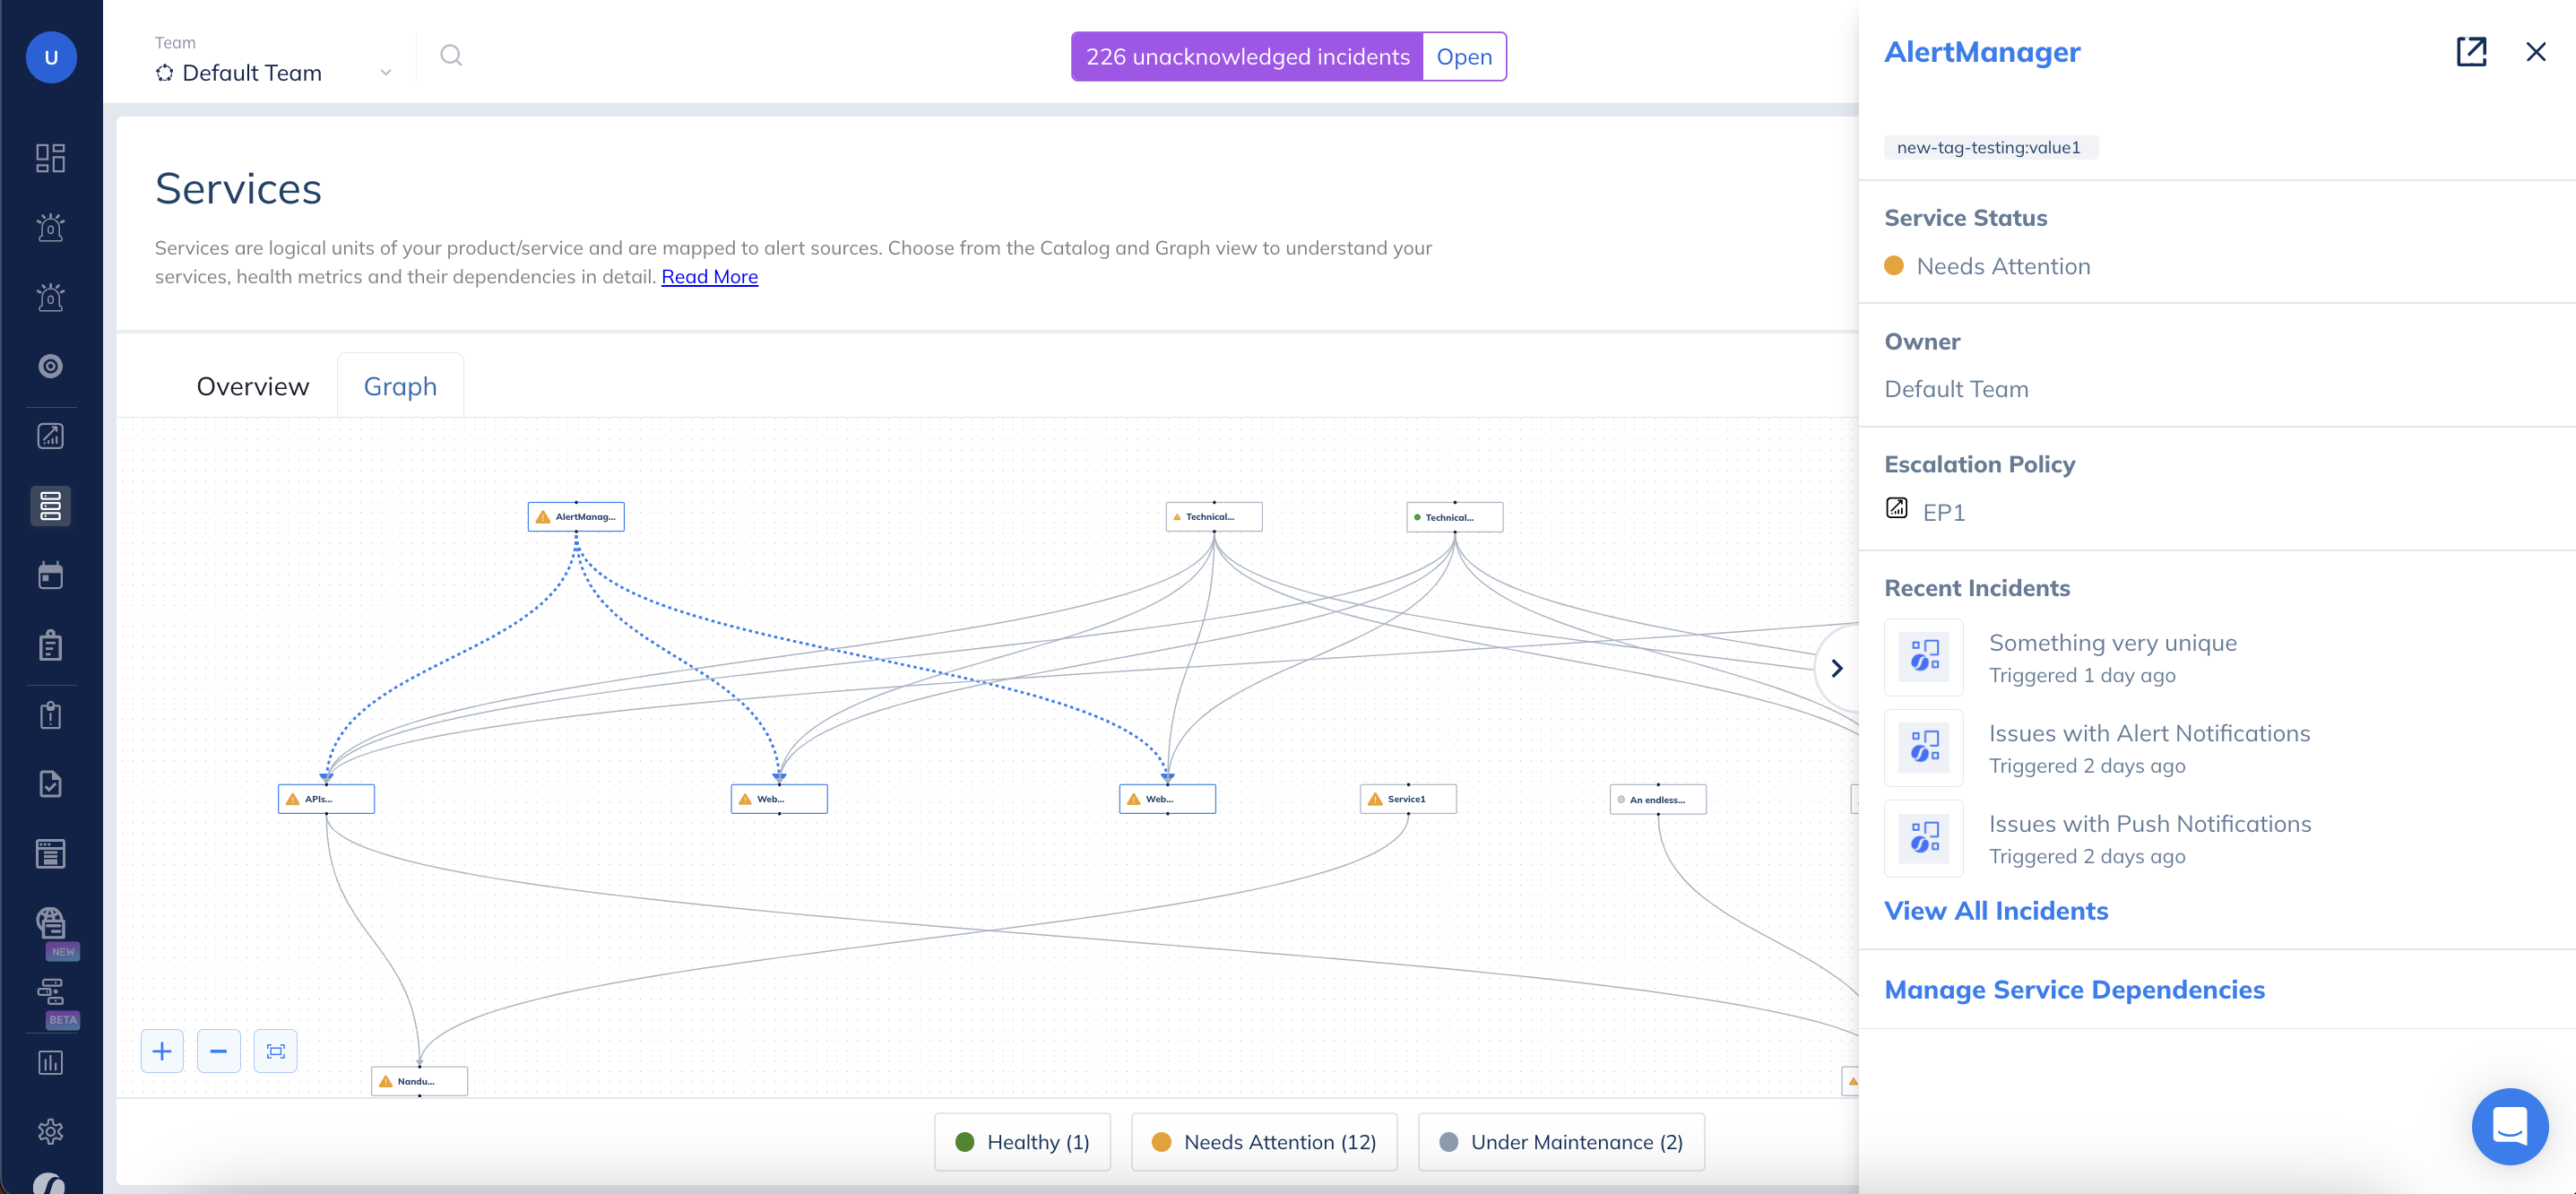
To open the right panel, click on the **<** icon located on the right side of the page. This panel provides a comprehensive list of both dependent and independent services. Selecting any service from the list will reveal additional information about that particular service.
Image. Access Right Panel
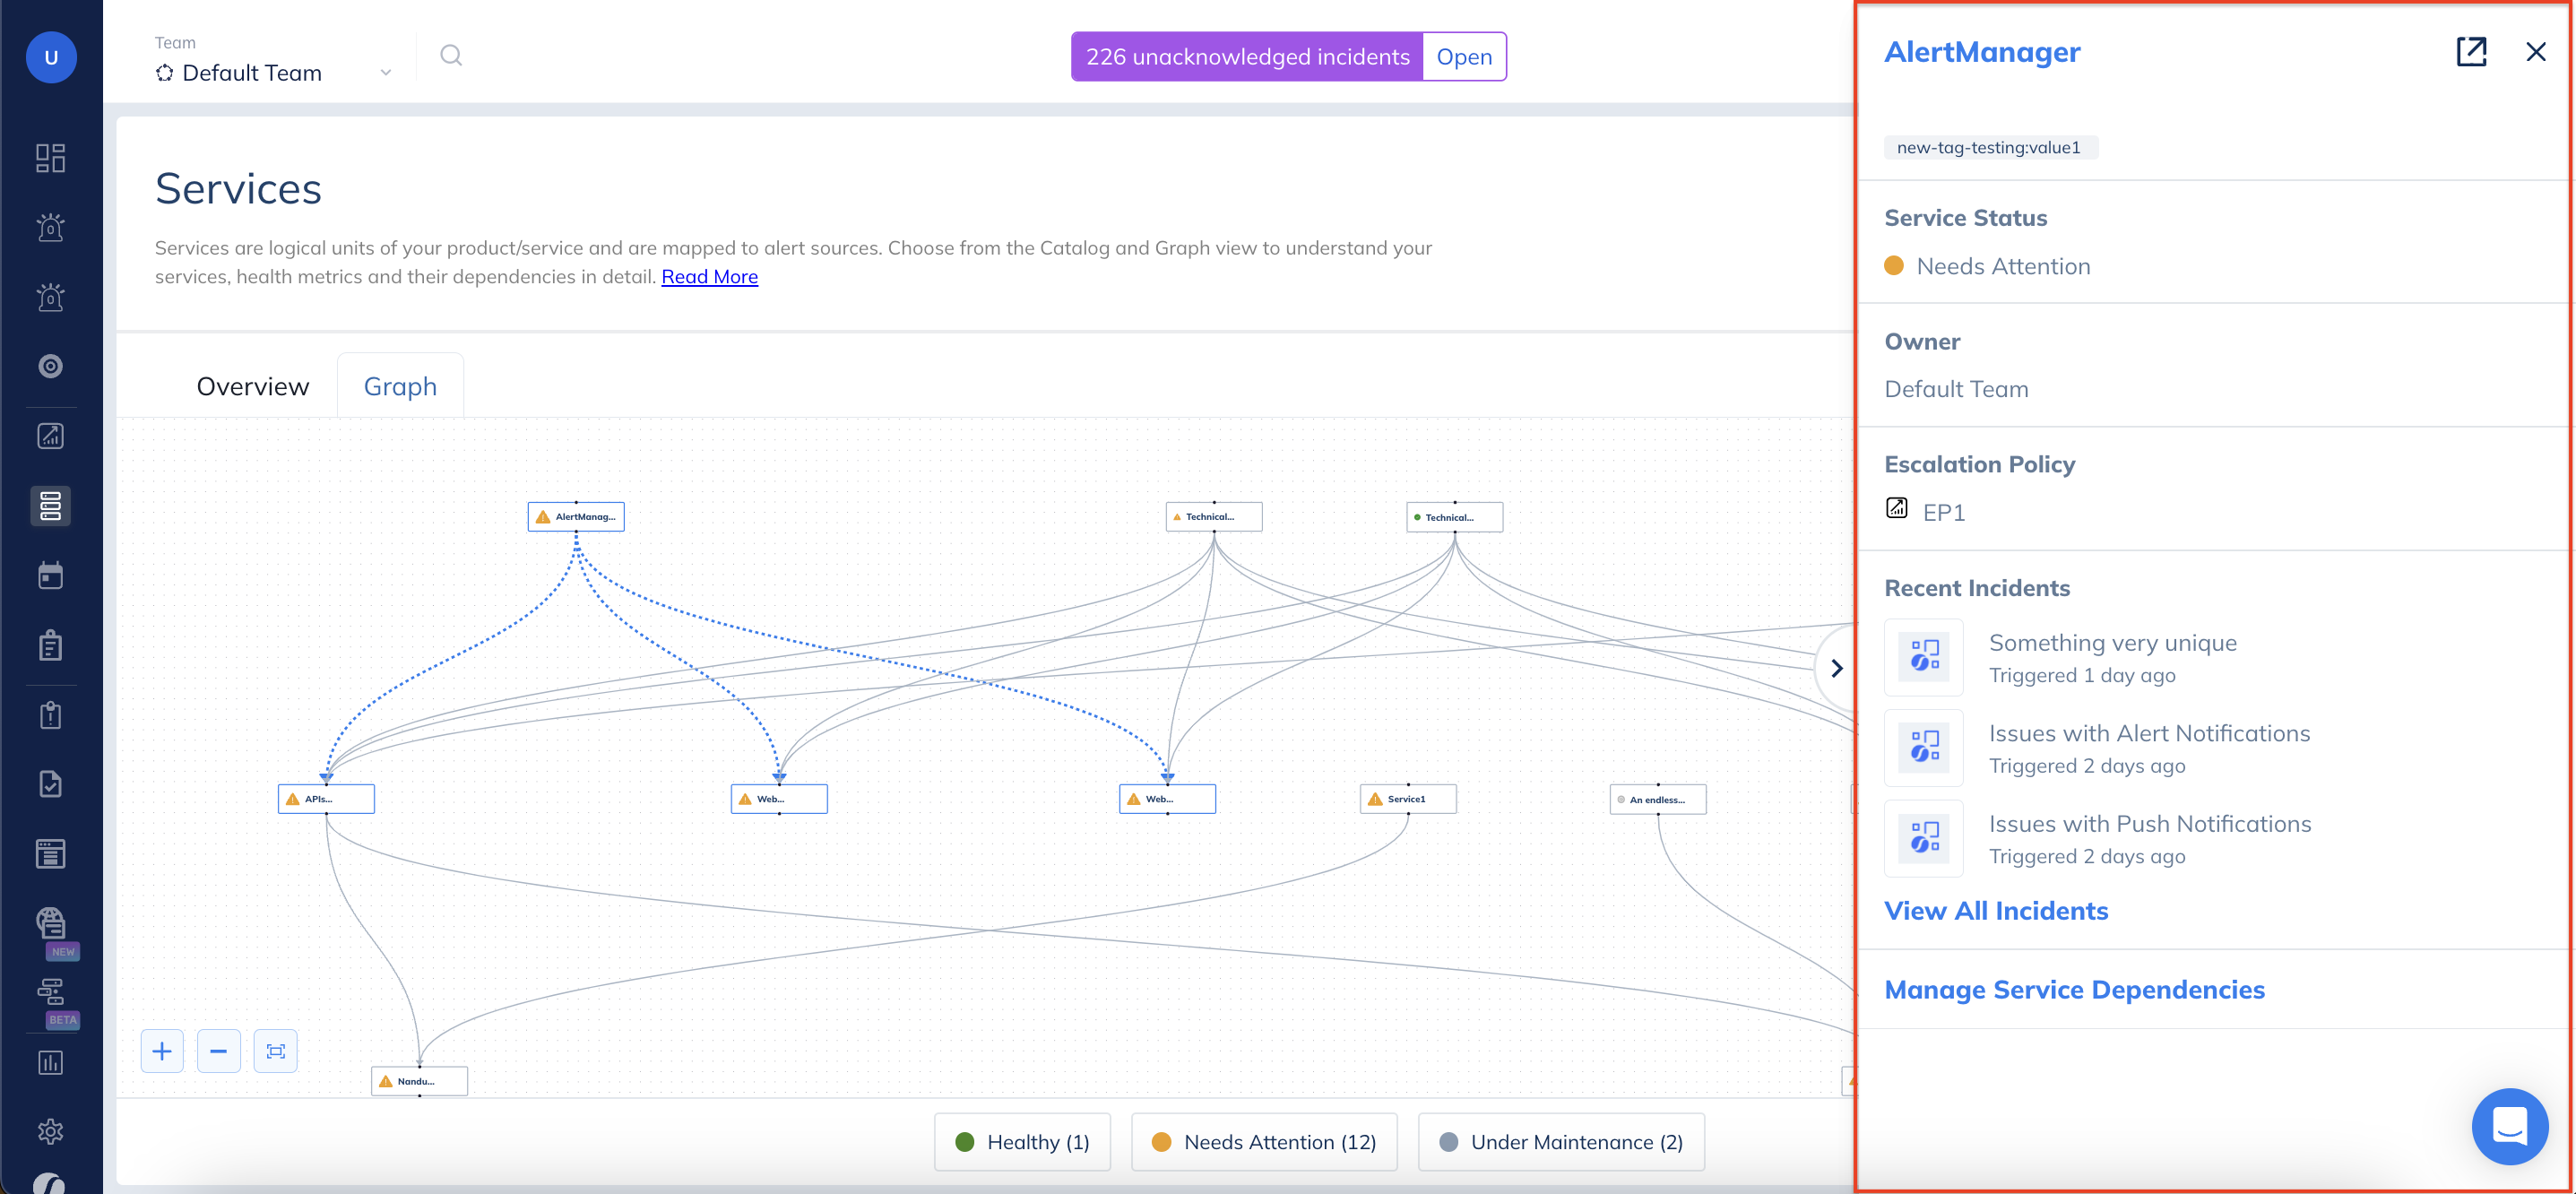
Image. View Service details on the right panel
The information displayed in the right panel includes:
| Field | Description |
| ------------------------------- | ------------------------------------------------------------------------------------------------------------------------------------------------------------------------------------------------------------------------------------------------------------------------------------------------------------------------------------------------------------------------------------------------------ |
| **Service Name** | Name of the Service. |
| **Status** |
Healthy - Denotes operational services, i.e., services with no open incidents.
Needs Attention - Denotes impacted services, i.e., services with one or more open incidents.
Under Maintenance - Denotes services that are under maintenance.
|
| **Owner** | Shows the user or squad that is the owner of the service. |
| **Escalation Policy** | Shows the escalation policy attached to the service. |
| **Recent Incidents** | Shows up to three most recent incidents that have come in for the service. To view all open incidents for the affected service, you can use the navigation under the list. |
| **Manage Service Dependencies** | A navigation link to manage dependencies on the service detail page. |
*Have any questions?* [*Ask the community*](https://community.squadcast.com/view/home)*.*
---
# Agent Instructions: Querying This Documentation
If you need additional information that is not directly available in this page, you can query the documentation dynamically by asking a question.
Perform an HTTP GET request on the current page URL with the `ask` query parameter:
```
GET https://support.squadcast.com/services/service-graph.md?ask=
```
The question should be specific, self-contained, and written in natural language.
The response will contain a direct answer to the question and relevant excerpts and sources from the documentation.
Use this mechanism when the answer is not explicitly present in the current page, you need clarification or additional context, or you want to retrieve related documentation sections.