# Incident Activity Timeline
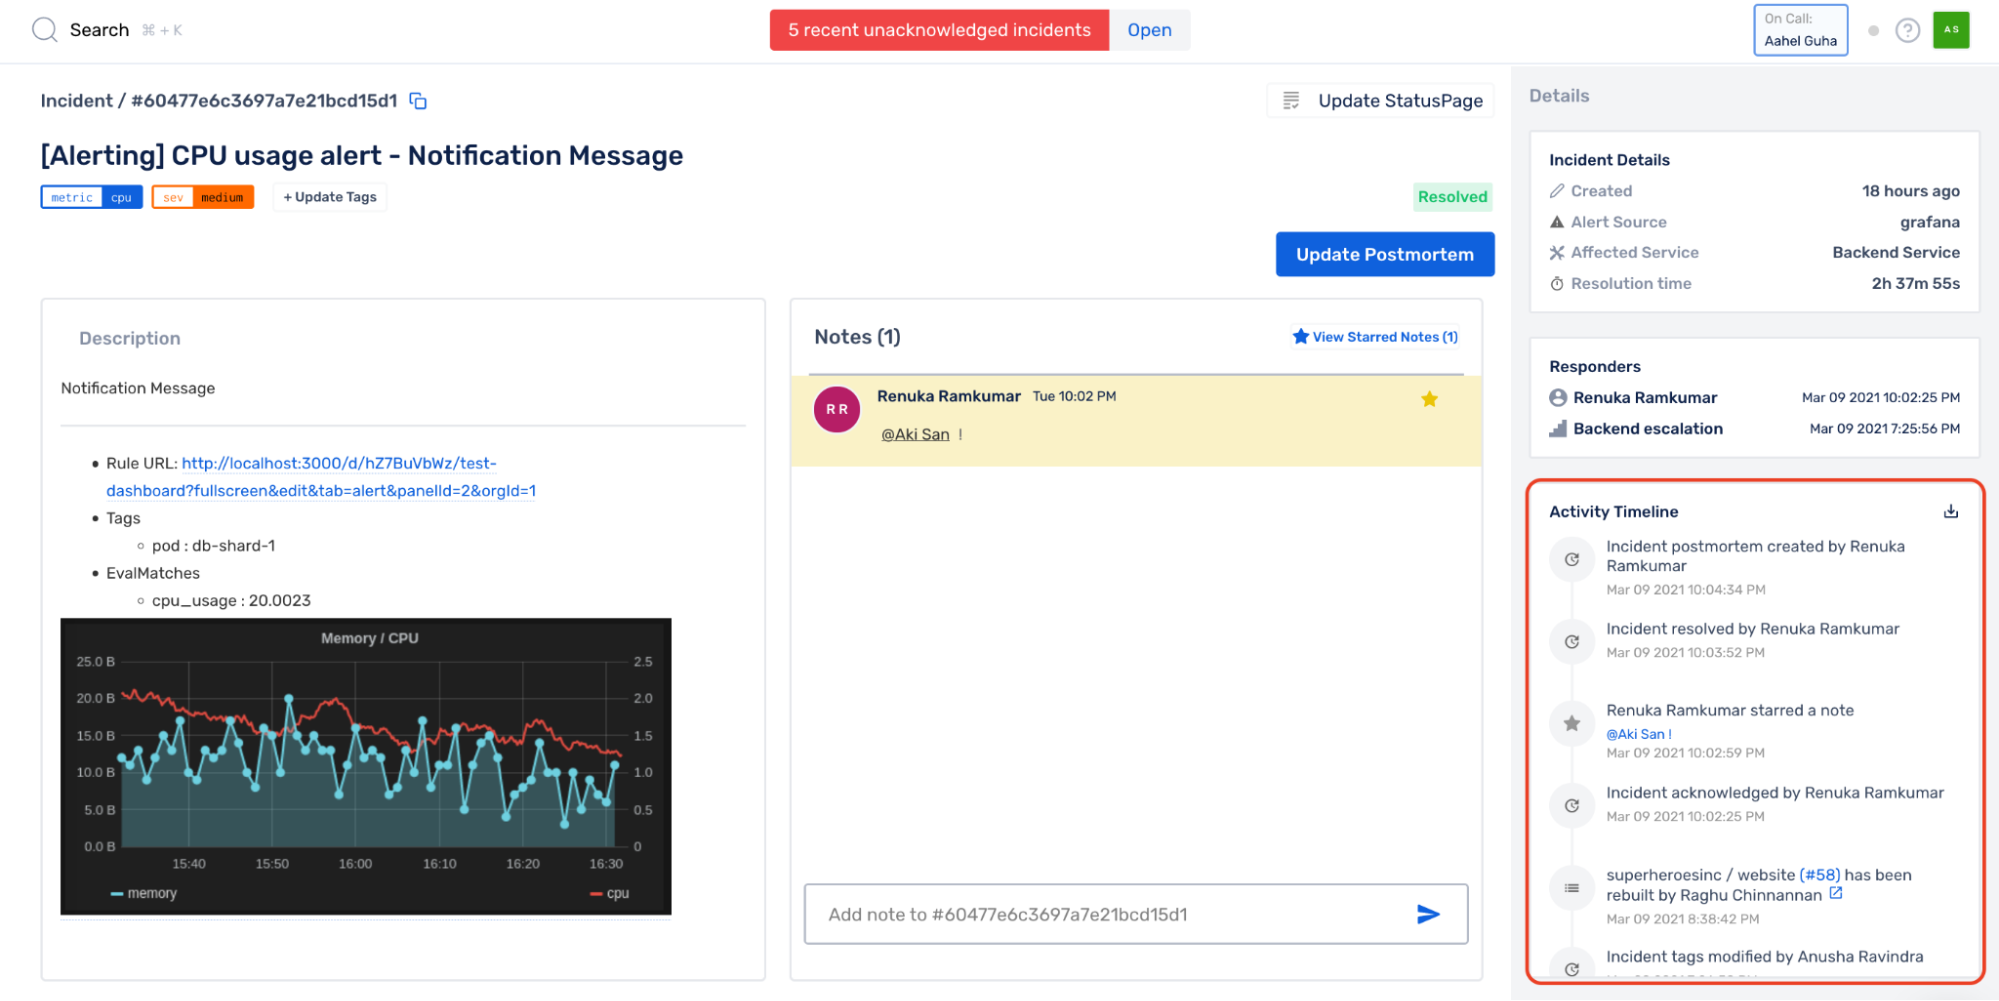
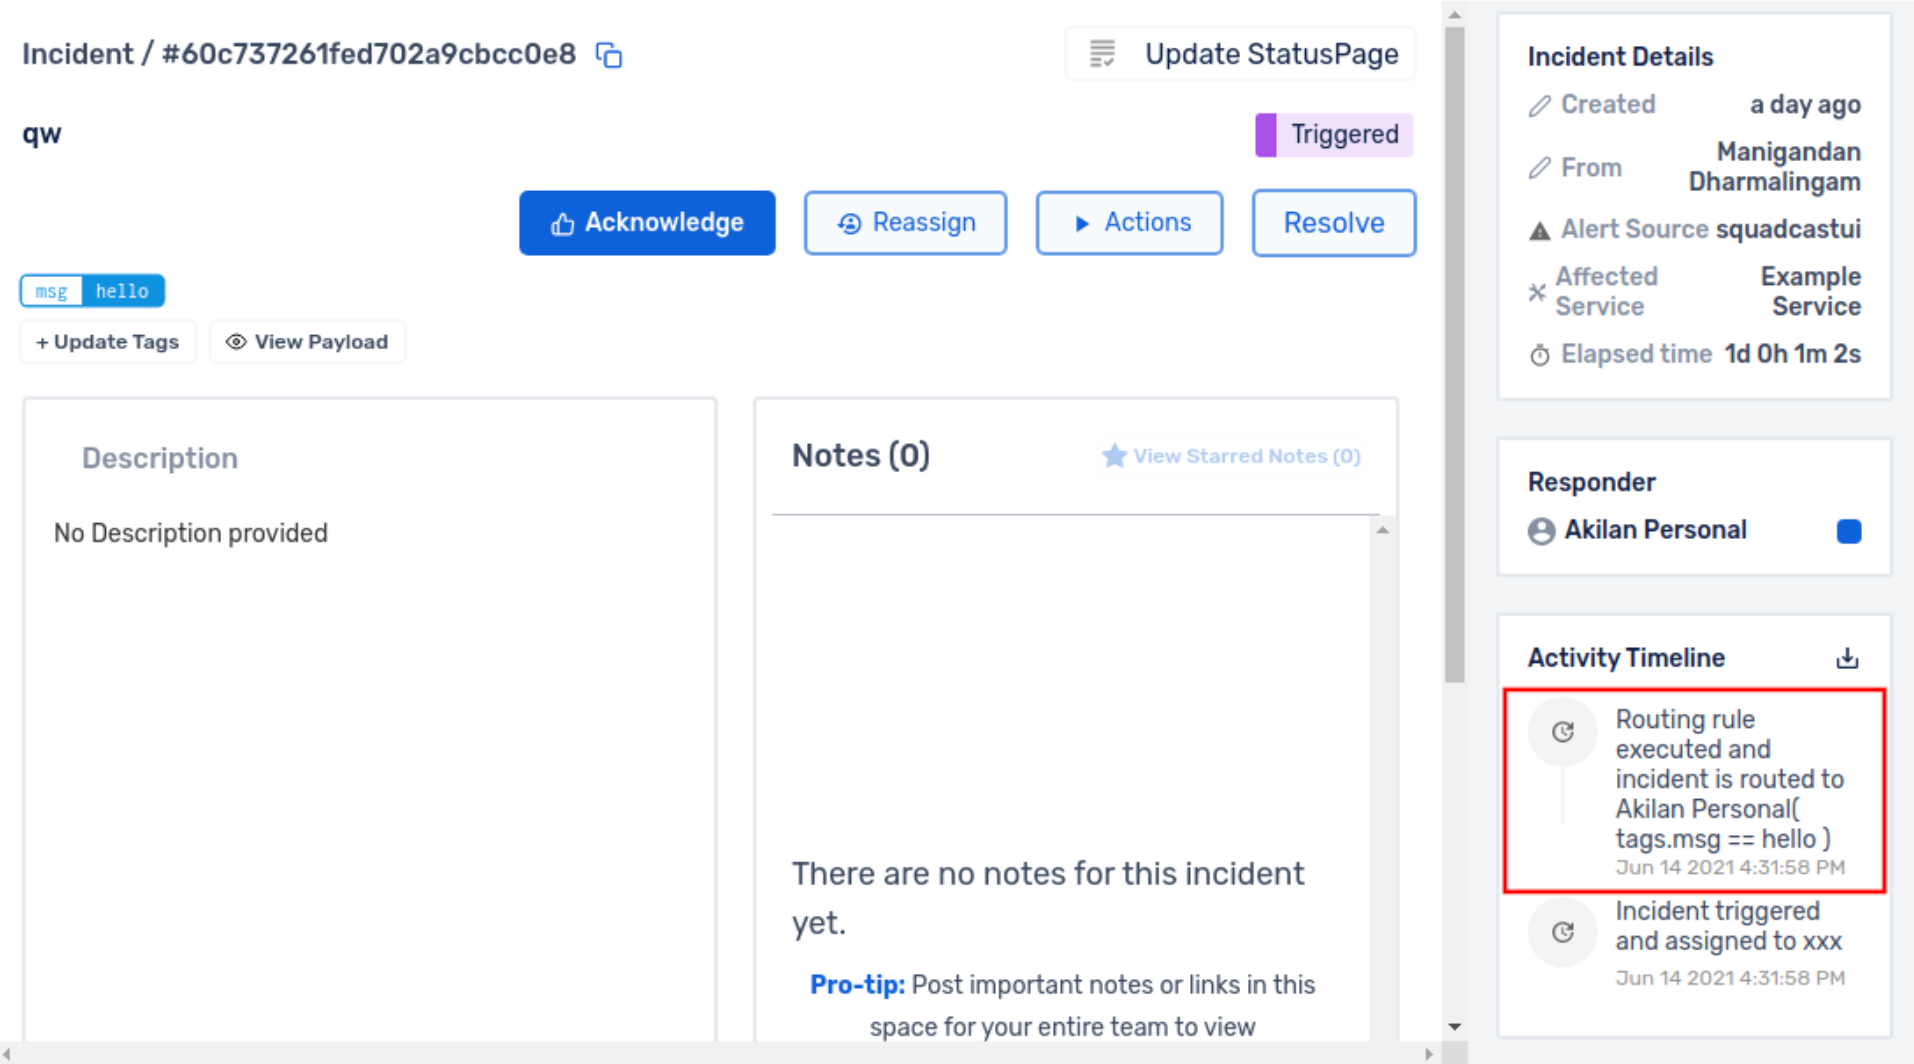
You can access the **Incident Activity Timeline** for a particular incident on the **Incidents** page in the web app and the timeline will be displayed on the right-hand side of the **Incident Details** page.
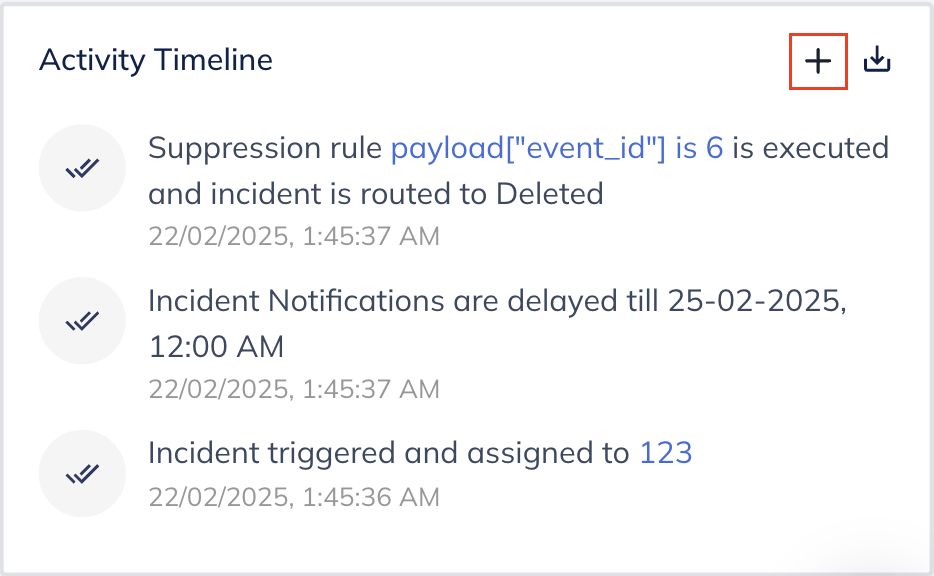
The Incident Timeline will display the timeline of the incident in reverse chronological order for the following details:
**(a)** when the incident was first **triggered** and **acknowledged**
**(b)** who **acknowledged** it
**(c)** who **reassigned** it and who it is **reassigned** to
**(d)** who **resolved** it and when
**(e)** what message was posted on the **status page**
**(f)** by whom and when the **postmortem** was created
**(g)** what **action** was taken
**(h)** starred comments from the **notes**
**(i)** if the incident is suppressed due to a **scheduled maintenance**
**(j)** if the incident is routed due to a **routing rule**
**(k)** if the incident is suppressed due to a **suppression rule**
**(l)** when a **postmortem status** is updated
As and when we add new features that affect an incident into the platform, related logs will get added to the incident's activity timeline
#### Exporting Incident Activity Timeline
The automated **Incident Activity Timeline** serves as a real-time chain of incident resolution activity. You can download this and use it for **Incident Reviews** or create **Postmortems**. **Incident Activity Timeline** can be exported by clicking on the **Download** icon at the top right corner of the **Activity Timeline**. You can download this in PDF or CSV formats.

## Manually Edit the Activity Timeline
If you are on our higher plans - either Premium or Enterprise, you will have the ability to manually add, edit and delete manual log entries into the activity timeline.
To add manual logs into the activity timeline, select **+** as highlighted below.
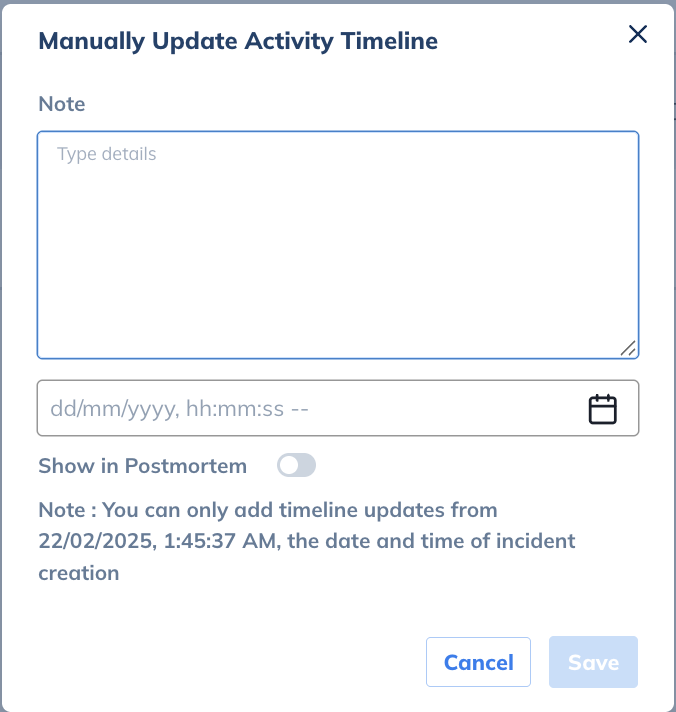
**Note:** Enter the contents of the log entry that needs to be added.
**Timestamp:** Select the timestamp that needs to be associated with the log entry. Based on the timestamp selected, this log will get placed accordingly either on top, at the end or in between other logs that are already present (chronological order). Timestamp selection cannot be at a date and time that is prior to the incident being triggered.
**Show in Postmortem:** Typically, when referenced, the activity timeline of the incident shows up in the the postmortem for the incident. Users can now decide if they want the manually added log entries also to show up in the postmortem or not, along with the default system log entries present in the activity timeline.
Once you click **Save**, this log will get added to the activity timeline.
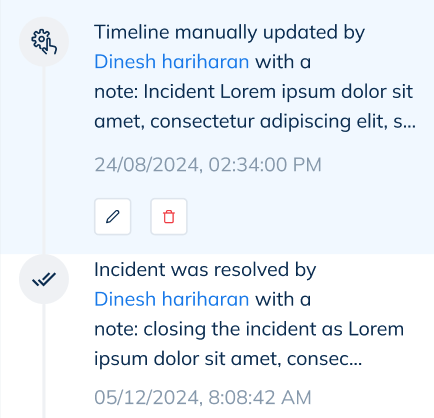
Once the manual log gets added to the activity timeline, it will be indicated by a different symbol for visual differentiation between a manually added log versus system logs.
Hovering over the manually added log gives you an option to either edit it or delete it as well.
*Have any questions?* [*Ask the community*](https://community.squadcast.com/view/home)*.*
---
# Agent Instructions: Querying This Documentation
If you need additional information that is not directly available in this page, you can query the documentation dynamically by asking a question.
Perform an HTTP GET request on the current page URL with the `ask` query parameter:
```
GET https://support.squadcast.com/incidents-page/incident-activity-timeline.md?ask=
```
The question should be specific, self-contained, and written in natural language.
The response will contain a direct answer to the question and relevant excerpts and sources from the documentation.
Use this mechanism when the answer is not explicitly present in the current page, you need clarification or additional context, or you want to retrieve related documentation sections.

.png?alt=media&token=eca71c4a-3558-4147-a05a-6b6b2498757b)