# Kibana
[Kibana](https://www.elastic.co/kibana/) is a free and open user interface that lets you visualize your Elasticsearch data and navigate the Elastic Stack.
Route detailed alerts from Kibana to the right users in Squadcast.
## How to integrate Kibana with Squadcast
### In Squadcast: Using Kibana as an Alert Source
1. Navigate to **Services** -> **Service Overview** -> select or search for your Service. Expand the accordion -> In the Alert Sources section, click **Add**.
2\. Select **Kibana**. Copy the displayed **Webhook URL** to [configure](#in-kibana-create-a-squadcast-webhook-alert) it within **Kibana**. Finish by clicking **Add Alert Source** -> **Done.**

{% hint style="warning" %}
**Important:**
When an alert source turns Active, it’ll show up under Configured Alert Sources, you can either generate a test alert from the integration or wait for a real-time alert to be generated by the Alert Source. An Alert Source is active if there is a recorded incident via that Alert Source for the Service.
{% endhint %}
### In Kibana: Create a Squadcast webhook alert
1. From the navigation bar on the left, select **Management** and then, select **Stack Management**

2. Select **Alerts and Insights** -> **Rules and Connectors**

3. Navigate to **Connectors** and click on **Create Connector.**

4. Select **Webhook** as a Connector.

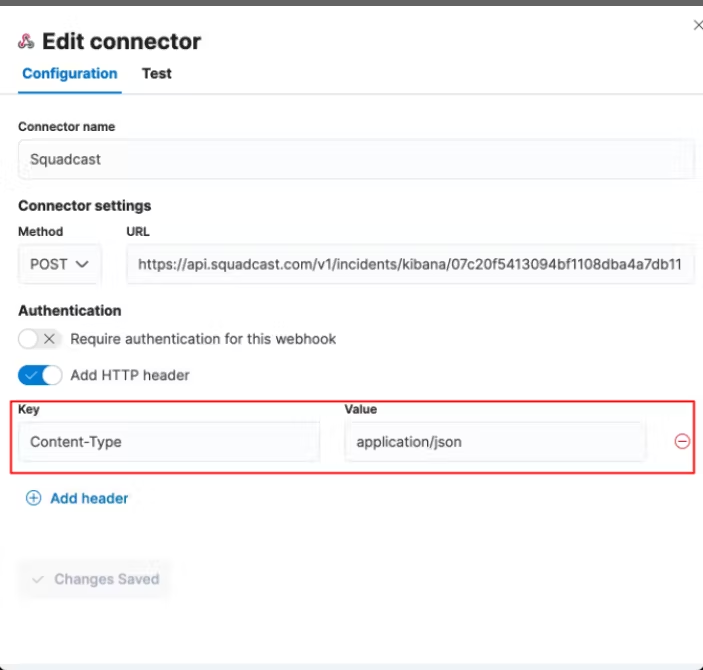
5. Provide a name for **Connector name**, choose **Method** as `POST` and paste the previously copied Squadcast Webhook URL in the **URL** field. Click on **Save.**\
\
Furthermore, please activate the **Add HTTP header** slider. Enter the header with the following content: `content-type: application/json`. Finally, click on the **Save** button.
6. Head over to **Rules** and click on **Create Rules**. Provide a name for the rule and select any of the options from the supported rule scenarios: **(a)** APM AND USER EXPERIENCE **(b)** LOGS **(c)** MACHINE LEARNING **(d)** METRICS **(e)** UPTIME
7. Select **Webhook** in the **Action** section.
 
8. Next, select the previously created Connector in the **Webhook connector** drop-down and paste the below **JSON** in the placeholder for **Body** and click on **Save**
```json
{
"actionGroupName": "{{alert.actionGroupName}}",
"actionSubgroup": "{{alert.actionSubgroup}}",
"alert_id": "{{alert.id}}",
"actionGroup": "{{alert.actionGroup}}",
"conditions": "{{context.conditions}}",
"denominatorConditions": "{{context.denominatorConditions}}",
"group": "{{context.group}}",
"isRatio": "{{context.isRatio}}",
"matchingDocuments": "{{context.matchingDocuments}}",
"numeratorConditions": "{{context.numeratorConditions}}",
"ratio": "{{context.ratio}}",
"timestamp": "{{context.timestamp}}",
"date": "{{date}}",
"kibanaBaseUrl": "{{kibanaBaseUrl}}",
"rule_id": "{{rule.id}}",
"name": "{{rule.name}}",
"spaceId": "{{rule.spaceId}}",
"tags": "{{rule.tags}}",
"type": "{{rule.type}}",
"environment": "{{context.environment}}",
"serviceName": "{{context.serviceName}}",
"threshold": "{{context.threshold}}",
"transactionType": "{{context.transactionType}}",
"triggerValue": "{{context.triggerValue}}",
"interval": "{{context.interval}}",
"isInterim": "{{context.isInterim}}",
"jobIds": "{{context.jobIds}}",
"message": "{{context.message}}",
"score": "{{context.score}}",
"topInfluencers": "{{context.topInfluencers}}",
"topRecords": "{{context.topRecords}}",
"anomalyExplorerUrl": "{{context.anomalyExplorerUrl}}",
"timestampIso8601": "{{context.timestampIso8601}}",
"results": "{{context.results}}",
"metric": "{{context.metric}}",
"reason": "{{context.reason}}",
"value": "{{context.value}}",
"alertState": "{{context.alertState}}",
"currentTriggerStarted": "{{state.currentTriggerStarted}}",
"firstCheckedAt": "{{state.firstCheckedAt}}",
"firstTriggeredAt": "{{state.firstTriggeredAt}}",
"isTriggered": "{{state.isTriggered}}",
"lastCheckedAt": "{{state.lastCheckedAt}}",
"lastResolvedAt": "{{state.lastResolvedAt}}",
"lastTriggeredAt": "{{state.lastTriggeredAt}}",
"latestErrorMessage": "{{state.latestErrorMessage}}",
"monitorId": "{{state.monitorId}}",
"monitorName": "{{state.monitorName}}",
"monitorType": "{{state.monitorType}}",
"monitorUrl": "{{state.monitorUrl}}",
"observerHostname": "{{state.observerHostname}}",
"observerLocation": "{{state.observerLocation}}",
"statusMessage": "{{state.statusMessage}}",
"downMonitorsWithGeo": "{{context.downMonitorsWithGeo}}",
"agingCommonNameAndDate": "{{state.agingCommonNameAndDate}}",
"agingCount": "{{state.agingCount}}",
"count": "{{state.count}}",
"expiringCommonNameAndDate": "{{state.expiringCommonNameAndDate}}",
"expiringCount": "{{state.expiringCount}}"
}
```

That is it, you are now good to go!
* Whenever an alert is generated in Kibana, an incident will be created in Squadcast.
* For any queries, please reach out to our Support team and they will be happy to assist you with your Kibana queries.
*Have any questions?* [*Ask the community*](https://community.squadcast.com/view/home)*.*
---
# Agent Instructions: Querying This Documentation
If you need additional information that is not directly available in this page, you can query the documentation dynamically by asking a question.
Perform an HTTP GET request on the current page URL with the `ask` query parameter:
```
GET https://support.squadcast.com/integrations/alert-source-integrations-native/kibana.md?ask=
```
The question should be specific, self-contained, and written in natural language.
The response will contain a direct answer to the question and relevant excerpts and sources from the documentation.
Use this mechanism when the answer is not explicitly present in the current page, you need clarification or additional context, or you want to retrieve related documentation sections.