# Grafana
[Grafana](https://grafana.com/) is a Data Visualization platform that allows you to query, visualize and alert on metrics no matter where they are stored.
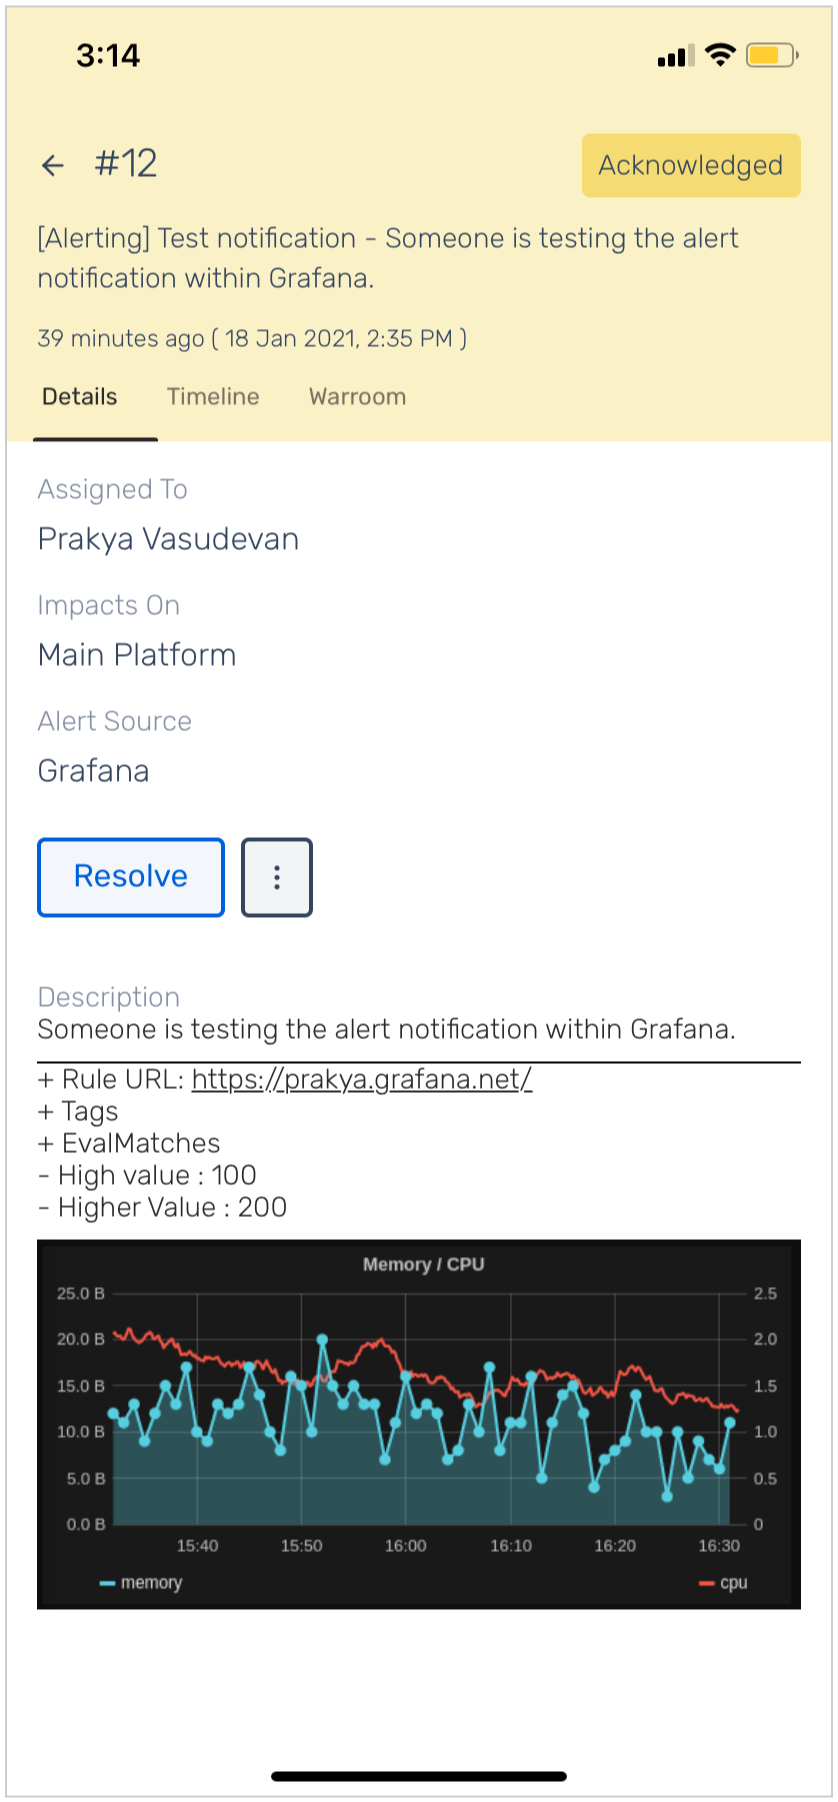
Route detailed alerts from Grafana to the right users in Squadcast.
## How to integrate Grafana with Squadcast
### In Squadcast: Using Grafana as an Alert Source
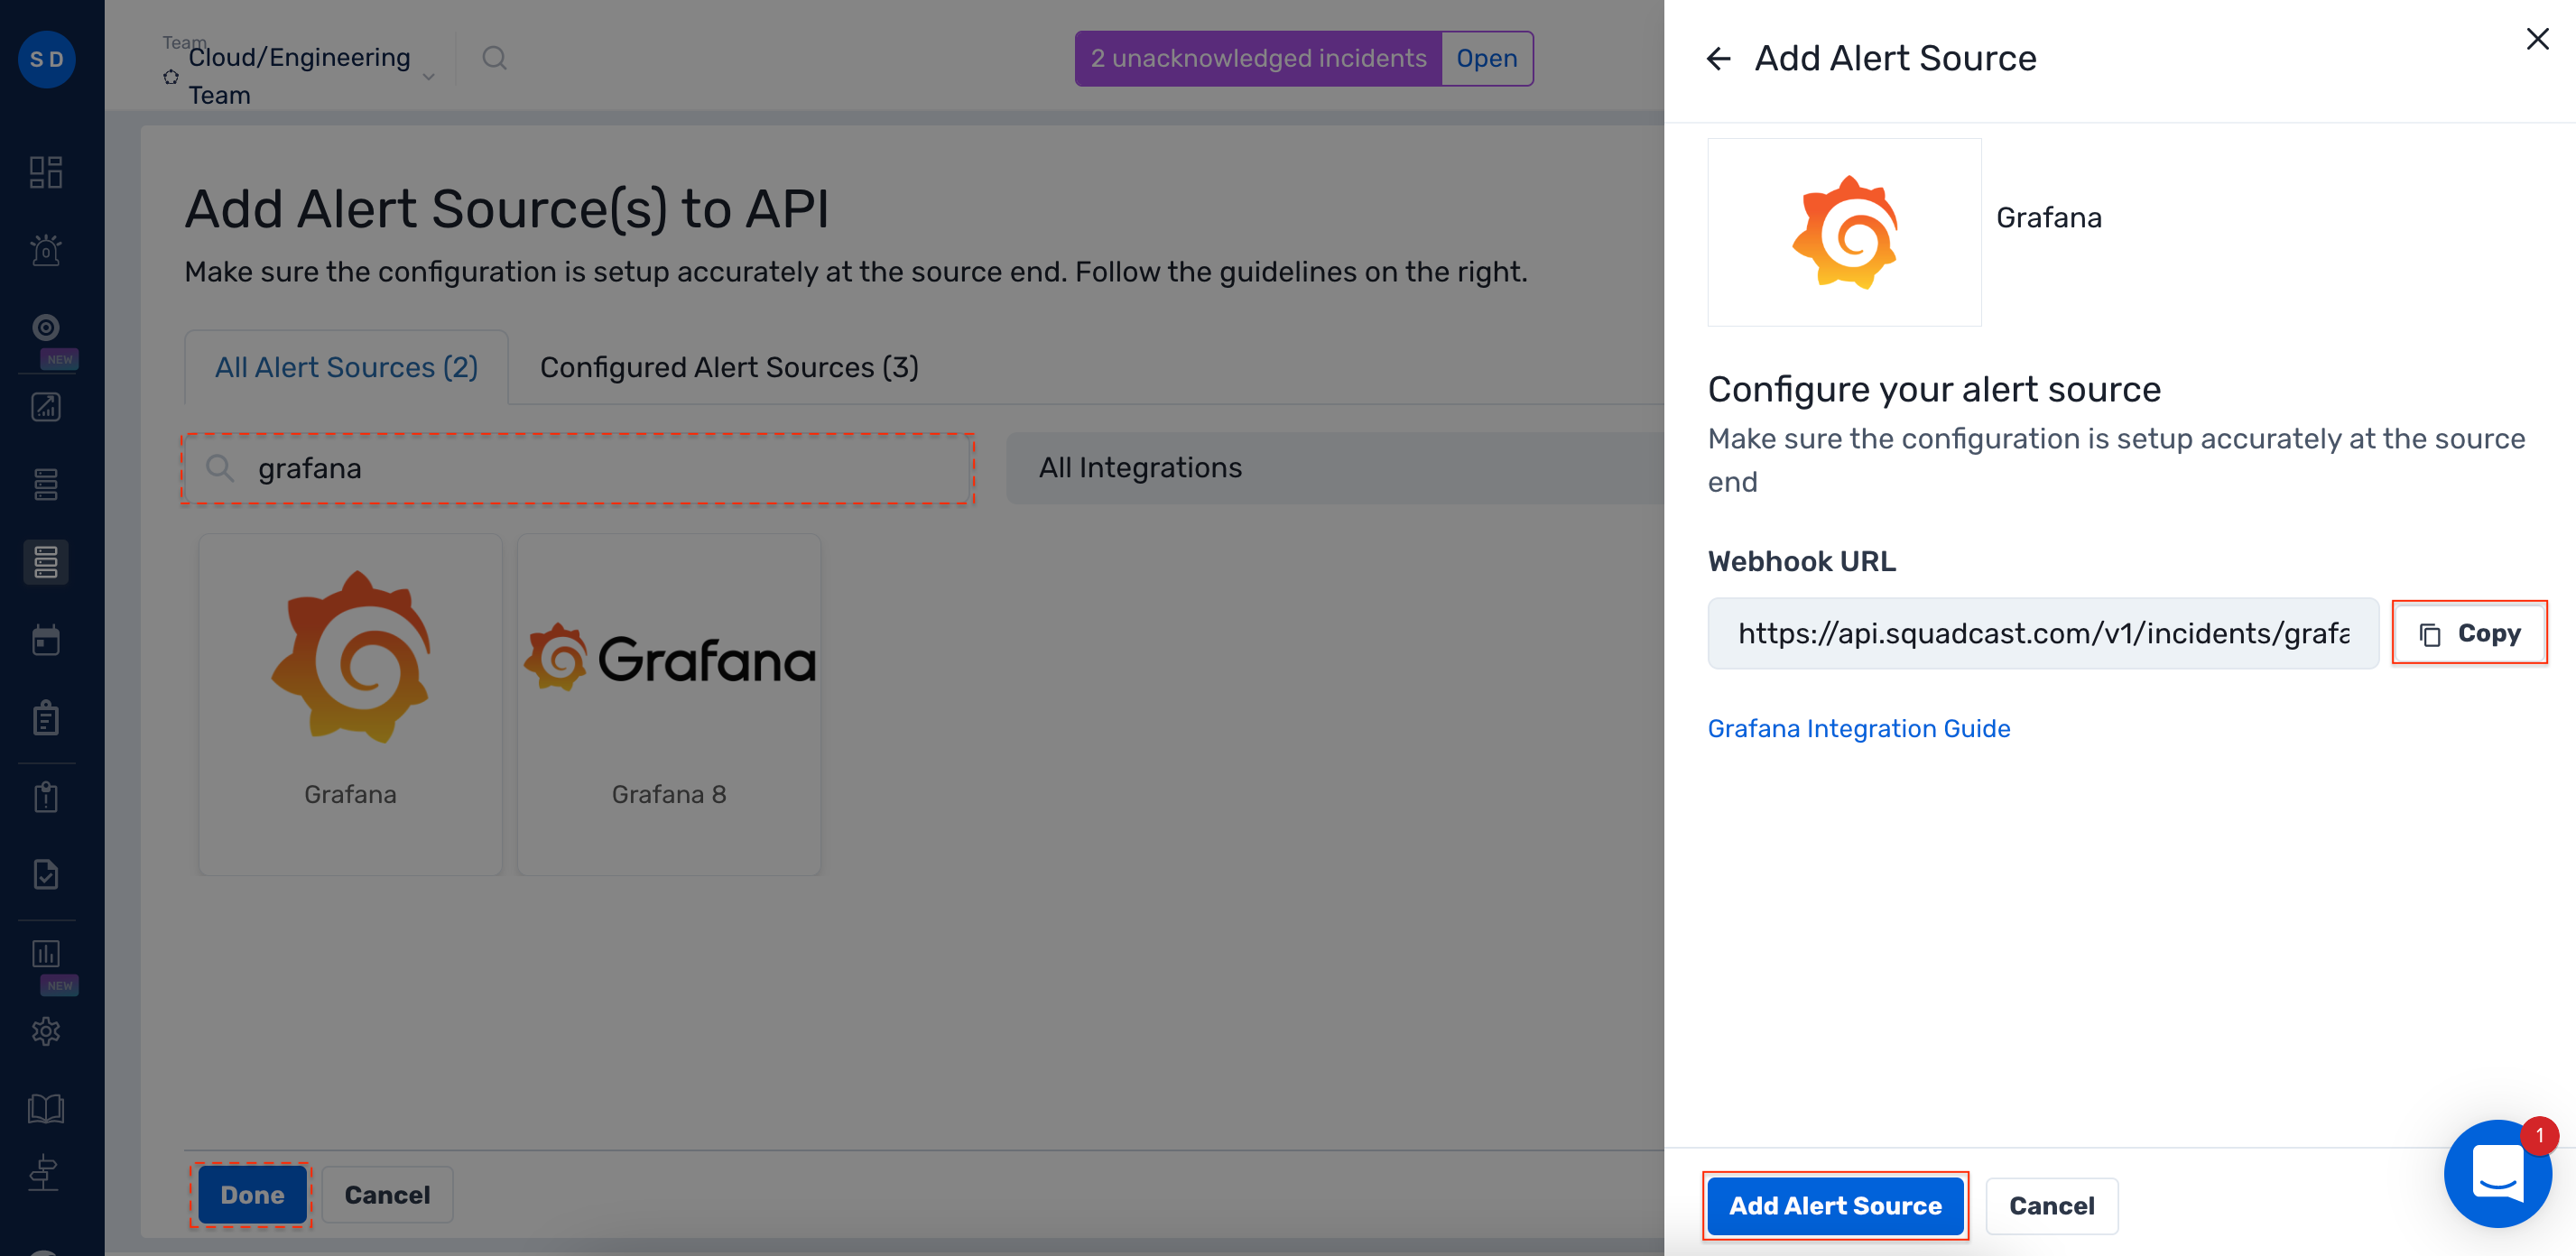
1. Navigate to **Services** -> **Service Overview** -> select or search for your Service. Expand the accordion -> In the Alert Sources section, click **Add**.
2\. Select **Grafana**. Copy the displayed **Webhook URL** to [configure](#in-grafana-create-a-squadcast-webhook-as-a-notification-channel) it within **Grafana.** Finish by clicking **Add Alert Source** -> **Done**.
{% hint style="warning" %} **Important****:**
When an alert source turns Active, it’ll show up under Configured Alert Sources. You can either generate a test alert from the integration or wait for a real-time alert to be generated by the Alert Source.\
\
An Alert Source is active if there is a recorded incident via that Alert Source for the Service.
{% endhint %}
### In Grafana: Create a Squadcast Webhook as a Notification Channel
1. Login to your Grafana dashboard, click on the **Alerting (Bell) icon** and select **Notification Channels**
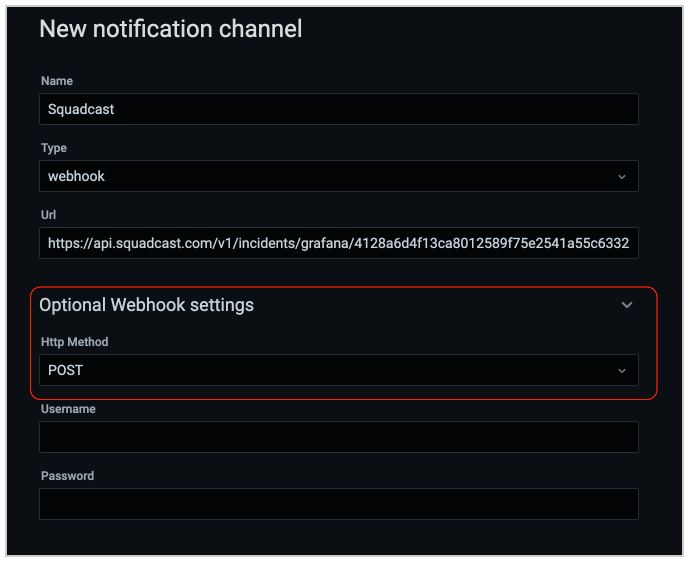
2. Click on **Add Channel** or **New Channel** and enter the Notification Channel `Name` as **Squadcast** and under `Type`, select **webhook**
3. Under `url`, enter the Webhook URL we have got from the Squadcast Service you copied before
4. Expand `Optional Webhook Settings` and select **POST** under `Http method`.
5. Under `Notification Settings`, check **Default** to send all alert data to Squadcast. You can uncheck this if you want only specific Grafana Panels to send alerts to Squadcast. [Move over to this section of our documentation to set up alerting for Specific Grafana Panels](#setup-alerting-for-specific-grafana-panels).
{% hint style="info" %}
**Sending Grafana Images into Squadcast**
* If you'd like to include images to your incident, check **Include Image** and you should see it as a part of your incident description in Squadcast.
* The Image URL must be public or accessible from your computer for it to be visible on Squadcast.
* Even if the Image is not accessible, the Image URL will be provided in the Incident Description.
{% endhint %}
{% hint style="info" %}
**Helpful Grafana Links**
* [Configuring External Image Storage in Grafana](https://grafana.com/docs/grafana/latest/installation/configuration/#external-image-storage)
* [Sending Images to your Incident Alerting Tool](https://grafana.com/docs/grafana/latest/alerting/notifications/#external-image-store)
{% endhint %}
{% hint style="warning" %}
**Important: Auto Resolve**
If you would like to enable **Auto-Resolve** in Squadcast, then make sure the **Disable Resolve Message** is unchecked.
{% endhint %}
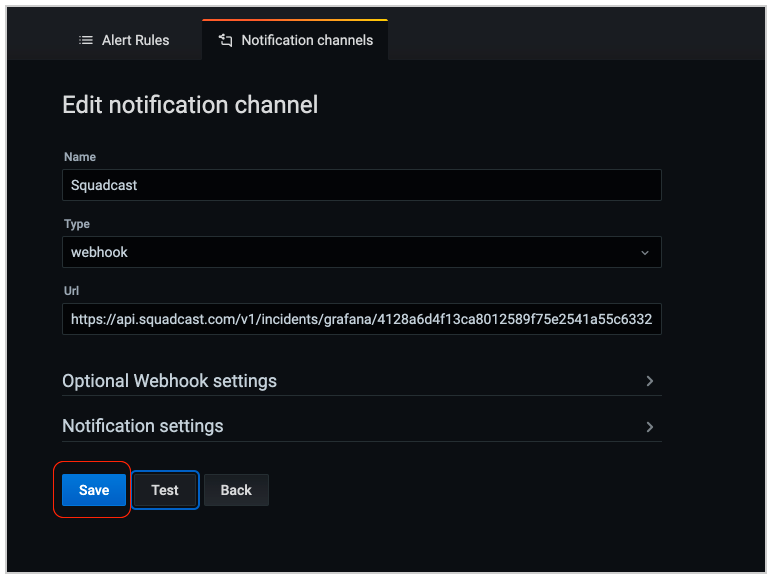
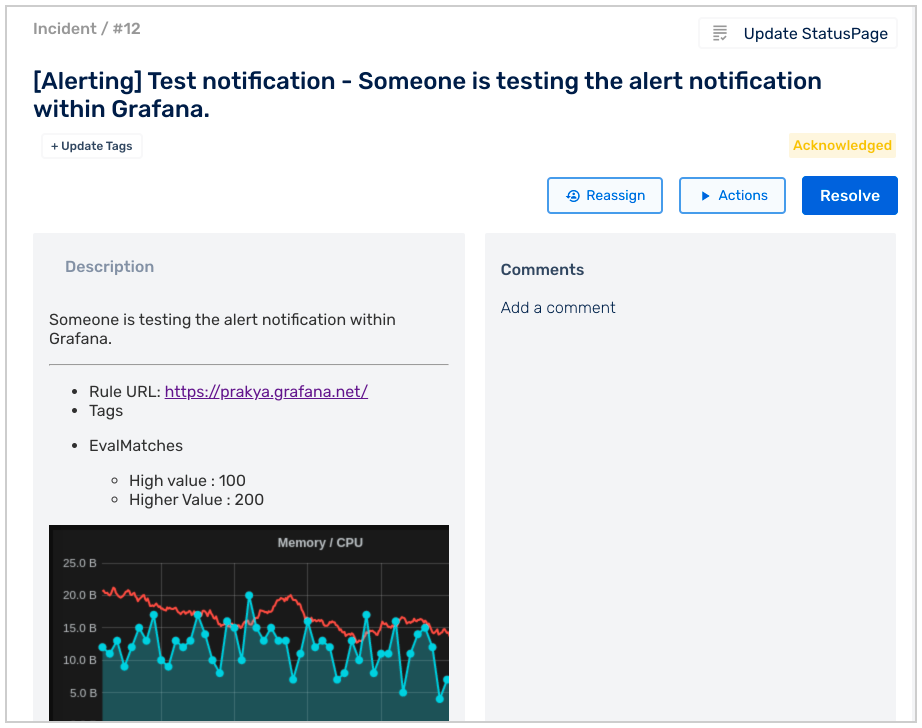
6. Click on **Save** to enable the integration. You can test the integration by clicking on **Test**. This will trigger a test incident in Squadcast.
## Setup Alerting for Specific Grafana Panels
{% hint style="info" %}
**Pre-requisite**
Squadcast should be added as a Notification Channel in your Grafana account. [Follow steps 1-5 here](#in-grafana-create-a-squadcast-webhook-as-a-notification-channel) and ensure the following:
* **Default** is unchecked to allow only specific alerts of your choosing
* **Include image** is checked if you want to add images to your Squadcast incidents
{% endhint %}
1. After you've saved **Squadcast Webhook** as a Notification Channel for your Grafana account, navigate to the panel from your Grafana Dashboard and under options select **Edit**
2. Under **Alerts**, click **Create Alert** button
3. To configure your alerts, set rules for when you want an alert triggered in the **Rules** section
4. In the **Notifications** section, under **Send to**, search and add your previously saved **Squadcast Webhook** and enter a Message for the alert and save it. The message here will be your Incident Message in Squadcast. Ensure that this message is meaningful and provides an immediate context in an on-call scenario
Now, whenever an alert is triggered in Grafana for that particular panel, an incident will be created in Squadcast.
* When it is resolved in Grafana, it will automatically get Resolved in Squadcast, provided the **Disable Resolve Message** checkbox is **unchecked**.\\
*Have any questions?* [*Ask the community*](https://community.squadcast.com/view/home)*.*
---
# Agent Instructions: Querying This Documentation
If you need additional information that is not directly available in this page, you can query the documentation dynamically by asking a question.
Perform an HTTP GET request on the current page URL with the `ask` query parameter:
```
GET https://support.squadcast.com/integrations/alert-source-integrations-native/grafana.md?ask=
```
The question should be specific, self-contained, and written in natural language.
The response will contain a direct answer to the question and relevant excerpts and sources from the documentation.
Use this mechanism when the answer is not explicitly present in the current page, you need clarification or additional context, or you want to retrieve related documentation sections.